September Recap and October Outlook
The Fed raised the key short-term interest rate by another 75 basis points at the September FOMC meeting, but the big news wasn’t the well-anticipated rate increase. It was Chairman Powell’s remarks at the press conference. He went well beyond any previous statements about the central bank’s level of commitment to fighting inflation. Powell focused on getting to a restrictive level of monetary policy, quickly. He defined “restrictive” as a level that puts meaningful downward pressure on inflation. This was interpreted by markets as putting a soft landing for the economy at substantial risk, if not making it impossible to achieve.
Let’s get into the data:
- The August non-farm payroll number was 315,000. The report from the Department of Labor marked the smallest increase since 2021.
- The unemployment rate increased to 3.7%, from 3.5% in July. The report also showed an increase in the labor force participation rate, to 62.4%.
- CPI rose 0.1% in August. The Bureau of Economic Statistics also reported a 12-month rise in CPI of 8.3%, slightly lower than July’s 8.5%. Food prices contributed the most to the increase, but they showed the smallest monthly jump since December 2021.
- The FOMC’s projections for the year-end Fed funds rate indicate another 1.00-1.25% in rate increases. Unemployment is projected to increase to 4.4% by late next year.
What Does All of That Data Add Up To?
The Fed is still playing catch-up from its belief that inflation would be transitory and the resulting inaction on rates until earlier this year. The problem has been compounded by the war in Ukraine and continued supply chain issues. Powell is now very concerned that expectations for higher inflation are becoming ingrained in consumers’ view of the economy. When it comes to inflation, expectations have a way of becoming reality, and Powell is very sensitive to the need to cut off the potential for 1970s-1980s style inflation.
The September jobs report released by the Department of Labor showed a non-farm payrolls increase of 263,000, lower than the Dow Jones estimate of 275,000. This is lower than the 315,000 gain in August and the lowest increase since April 2021. However, the unemployment rate trended back down to 3.5%, as the labor force participation rate retraced to 62.3% and the size of the labor force decreased by 57,000.
While an improvement, the number still indicates a strong jobs market and is probably not enough change the trajectory of interest rate increases, at least through the early November FOMC meeting.
Chart of the Month: Number of U.S. Job Openings
The number of job openings decreased in August by the largest amount since the beginning of the pandemic in 2020, offering some hope that the Fed’s rate hikes are finally slowing the labor market.
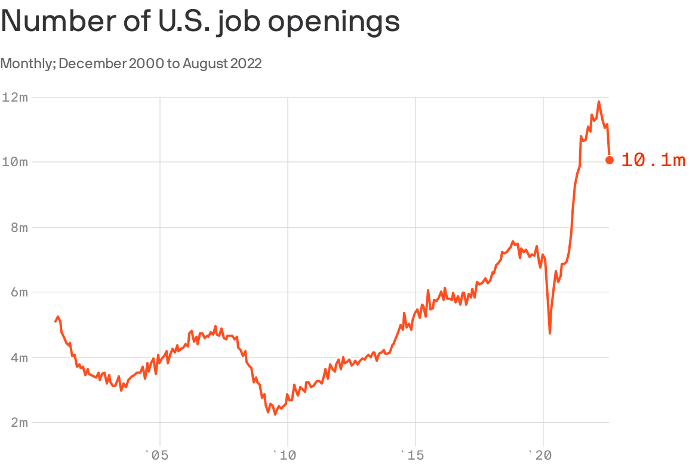
Source: U.S. Bureau of Economic Analysis; Axios Visuals
Equity Markets in September
- The S&P 500 was down 9.34%
- The Dow Jones Industrial Average fell 8.84%
- The S&P Mid-Cap 400 decreased 9.36%
- The S&P Small-Cap 600 declined 10.05%
Source: S&P. All performance as of September 30, 2022
September lived up to its reputation as the bad month for equity markets, as the S&P dipped below the June low. The Dow officially entered a bear market, as it was down 21.94% from its Jan. 4, 2022 high. The Q2 2022 earnings season ended, with preliminary results showing 372 issues beating estimates. Third quarter earnings estimates are estimated to decline by 7%, but Q4 is the biggest concern as ongoing inflation, pullbacks in consumer spending and Fed rate increases begin to have significant impact.
Bond Markets
The 10-year U.S. Treasury ended the month at 3.81%, up from 317% in August. The 30-year U.S. Treasury ended August at 3.77%, up from 3.28% points. The Bloomberg U.S. Aggregate Bond Index ended September down 4.32%. The year-to-date return at month end was -14.60%.
The Smart Investor
Fed guidance for additional rate increases in the last three months of this year means that the pressure on investors and consumers is unlikely to abate, even if inflation does trend down.
As we head into the final stretch, staying focused on long-term goals and continuing to “batten down the hatches” for short-term volatility is the way to maintain equilibrium.
Ensuring that you can meet your spending needs while continuing to keep savings goals on track, or if you’re retired, staying within current income guidelines is critical.
Cash flow planning can help you get clarity on your current picture, and can link your spending to your long-term goals in ways that can uncover opportunities you may be overlooking. For example:
- Paying down or consolidating debt, or taking advantage of education loan forgiveness
- Rethinking risk parameters
- Increasing emergency fund levels
- Proactive tax planning, including Roth conversions and charitable giving
If you don’t have a cash flow plan, it’s a great time to get thinking about it. Working with a financial advisor can help you bring all the pieces of your financial plan together.
IMPORTANT DISCLOSURES
Part of this material was prepared by Broadridge Investor Communication Solutions, Inc and Seven Group, Inc.
Investment advisory services offered through TCG Advisors, an SEC registered investment advisor. Insurance Services offered through HUB
International.
This message is for informational purposes only and does not constitute an offer to sell, a solicitation to buy, or a recommendation for any
security, or as an offer to provide advisory or other services in any jurisdiction in which such offer, solicitation, purchase or sale would be
unlawful under the securities laws of such jurisdiction. All statements that are not historical facts are forward-looking statements, including any
statements that relate to future market conditions, results, strategies, opportunities, positioning or prospects. Economic and market conditions
change frequently, there can be no assurance that the trends described here will continue or that any forecasts are accurate. Remember all
investing involves risk.
The information contained in this presentation is not intended to be a complete discussion of all federal or state income tax requirements. This
information cannot be used by an investor to avoid any income tax penalties that may be imposed under the Internal Revenue Code. Investors
should seek advice from a financial and/or tax advisor about the potential tax implications of their investments through TCG Advisors or HUB
International, based on their individual circumstances.
Past performance may not be indicative of any future results. No current or prospective client should assume that the future performance of
any investment or investment strategy referenced directly or indirectly in this brochure will perform in the same manner in the future. Different
types of investments and investment strategies involve varying degrees of risk—all investing involves risk—and may experience positive or
negative growth. Nothing in this brochure should be construed as guaranteeing any investment performance.
The information contained in this document is for general guidance only and should not be used as a substitute for your consultation with the
appropriate legal, accounting, tax, investment and compensation professionals regarding your personal situation. Before making any decision
or taking any action, you should consult a professional about your specific situation. You accept full responsibility for the use of any information
in this brochure and in no event will TCG Advisors, or its parents, affiliates, employees or agents, be liable to you or anyone else for any
decisions made or action taken in reliance on such information or for any special, consequential, or similar damages, even if advised of the
possibility of such damages. TCG.60.2022
Financial assistance is available! Get matched with a Financial Advisor:
